Let me start this column by saying that I love analytics in baseball, and have for years. When I noticed a rift between some pitchers on the 2009 Yankees and Jorge Posada , I did a segment on my tv show entitled “Posada Non Grada”. I noticed very early in the season that the chemistry wasn’t there, especially when it came to the relationship between Georgie and AJ Burnett. The things I noticed were subtle at first, in fact, some die-hard Posada fans felt I was being too critical. But, as the season went along the issues became more glaring. I got to a point where I stated on my show that Jose Molina should catch AJ exclusively, and I used a stat called “Catcher’s ERA”. My co-host and brother Anthony looked at me like I had 2 heads saying – “Catchers don’t have ERAs !! My retort was : They do now … thanks to SABR-metrics. I was steadfast in my opinion, and it helped that advanced metrics backed-up my opinion. Fast-forward to October before the ’09 playoffs started. Mike Francesa & Michael Kay were screaming at the top off their lungs on the radio that .. You can’t bench Posada & take his superior bat out of the line-up in a playoff game just because Burnett prefers to pitch to Molina !! They both said they would never take Posada’s bat out of a playoff game and completely dismissed the suggestion that the Yankees should put Molina behind the plate in games started by Burnett.
Well .. both Mikes were wrong, and the Yankees, as I was hoping, made the right decision and did bench Posada every time Burnett pitched during the entire playoff run that year. Good thing !! The Yankees would not have won Championship #27 if not for that “small” decision. Molina was able to get the best out of the mercurial AJ Burnett. Jose’s signal calling was superb. He got AJ to trust him & not shake him off. Jose blocked that knuckle-curve in the dirt better than Georgie also. There was one particular play in the 4th inning of Game 2 of the WS when there was a runner on 1st, no outs. The Yankees were trailing in the series 1-0 and also in the game 1-0. Burnett threw what certainly looked like a wild pitch that bounced in the LH batters box. Molina not only back-handed the ball, but came up throwing to 1B picking off a shocked Jason Werth who had stepped towards 2nd thinking it was a wild pitch. So, instead of man on 2nd, no outs and AJ on the verge of a meltdown, we had 1 out no one on base. That play seemed to settle down Burnett. He cruised from that point, not allowing another run : 7 Inn, 4H, 1R, 2BB/9K, while the Yankee offense staged a come-back off Pedro Martinez 6 Inn, 6H, 3R 2BB/8K for a 3-1 Win to even the series and set the stage for .. the Yankees 27th Championship Victory (in 6 games).
The next season 2010 when I was frustrated-beyond-belief to see Mark Teixeira being victimized by the shift league-wide (not just by Joe Maddon – TB ) I repeatedly said this is huge. This is a game-changer, and not in a positive way. This is unacceptable. Tex’s batting average fell from .292 to .256 in one year !! Some said that it was just a coincidence that his lower BA came when the entire league started shifting on him. Coincidence, I didn’t think so. I turned to advanced metrics again and came up with BABIP – Batting Average when Ball is put In Play. When I saw Tex’s BABIP was nearly the lowest in the entire league I said BINGO !! BABIP / analytics proved my point.
10 years ago, SABR-metrics were not widely accepted, but I was on-board early. I still am. However when an analytics department decided that it didn’t matter that Tex’s BA plummeted , as long as his power-numbers were still there, this is where I parted ways. We did not disagree about the stats themselves, but the overall conclusion of the stats. The judgements, the core philosophy if-you-will.
In 2010 Yankees management trivialized the fact that Tex, a lifetime .300 hitter, saw his BA plummet due to the shift because you can just .. hit over the shift. Hence we started hearing the term and seeing the stat ..”launch angle”. Back in the day, we called it an “upper-cut swing”. With that in mind the Yankees blockbuster move in 2010 was to trade for LHB Curtis Granderson. This was the big move after we heard that the Yankees were going to concentrate on “pitching, pitching, pitching”. Curtis did exactly what the Yankees projected he would. He hit home runs. Lots of them. In his first 3 years he hit 24 in 2010, 41 in 2011, and 43 in 2012. But there were 3 alarming (but not unpredictable) trends that developed. First off – in 2012 Grandy did hit 43 HRs , 106 RBI but his batting average suffered. His slash-line was ..
.232 BA / .319 OBP / .492 SLG with
Secondly he was K’d 195 times
The biggest problem is that the Grady Man had evolved into a one-dimensional, dead-pull, low contact, high strike-out home run hitter, which imo doesn’t bode well for post season success. Here are Granderson’s 2012 postseason stats after a 43 HR regular season :
![]()

In fact, the whole batting order evolved into a one dimensional, left-handed , pull-happy, home run reliant , live-by the 3R HR, die-by the 3R HR team. In the 2012 ALCS vs. the Tigers, the Yanks team Batting Average was .157. The Bombers bats went silent. The Yankees were swept. Brian Cashman doubled-down on his belief that Home Run hitting was the formula to success. When asked if he regretted not being able to play small at opportune times, he said :
“I’m not going to turn myself into the Bronx Bunters because all of a sudden we didn’t hit for this week in October. That’s not our DNA. That’s not what makes us successful. And that’s certainly not what’s getting us into the postseason every year.”
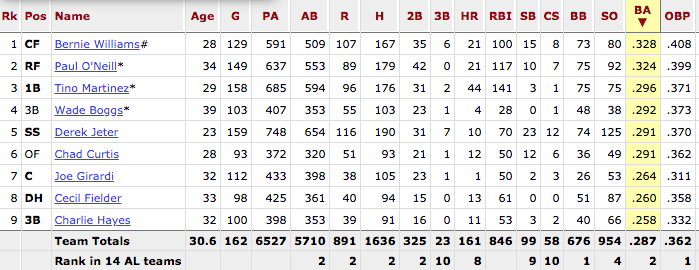
To live-and-die by the 3R Homer, is not the philosophy that built the Yankee Dynasty from 1996 – 2000. The Dynasty team was built on solid starting pitching and fielding, an elite bullpen, and a well balanced offense. An offense that was not dependent on the long ball. Let’s take a look at the A.L. Rank for the 1996 Yankee Offense that ended a 18 year franchise drought by defeating the defending Champion Atlanta Braves with 3 future HOF Starters
1996 Yankee Offense
.288 BA ranked 2nd (of 14 teams) in AL
.360 OBP ranked 3rd in AL
909 K’s ranked 2nd best in AL
871 Runs ranked 9th in AL
162 HRs ranked 12th in AL
See stats below … or I guess you can say ANALYZE THIS :
1996

1997
1998
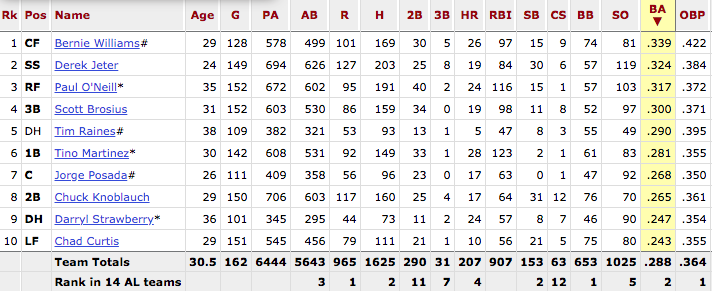
1999
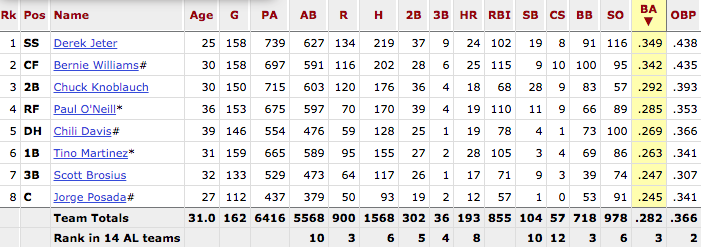
2000
2009
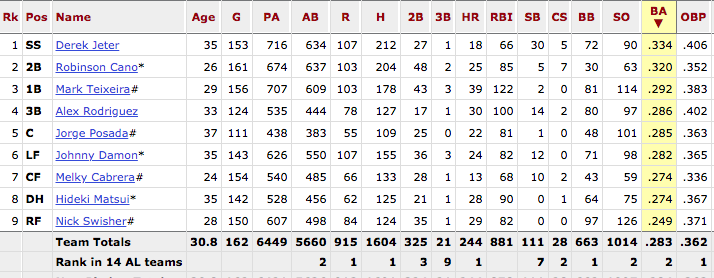
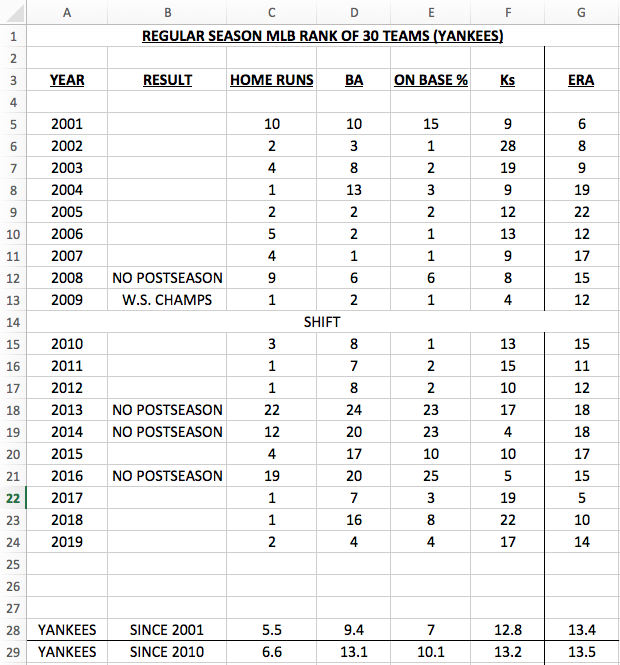
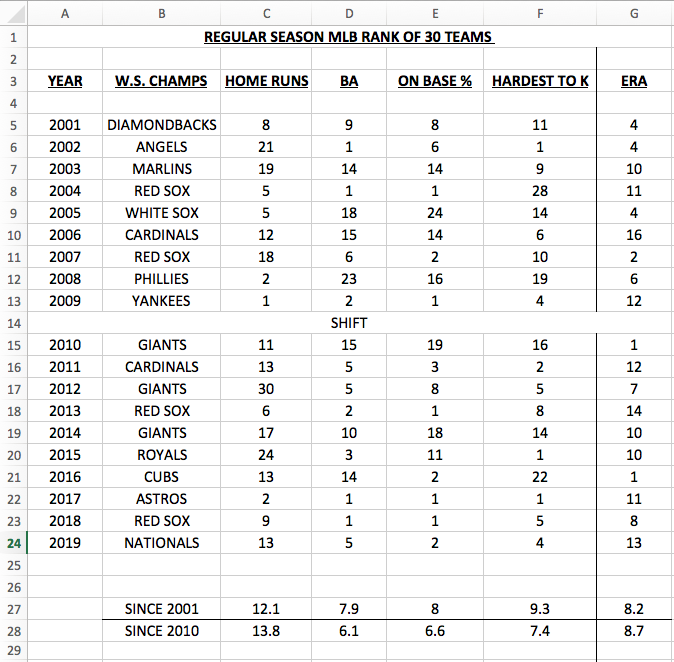
Now let’s look at the Yankees after the ’96- 2000 Dynasty. Let’s compare the Yankees from 2001 – 2019 to the World Series Winner each year.
